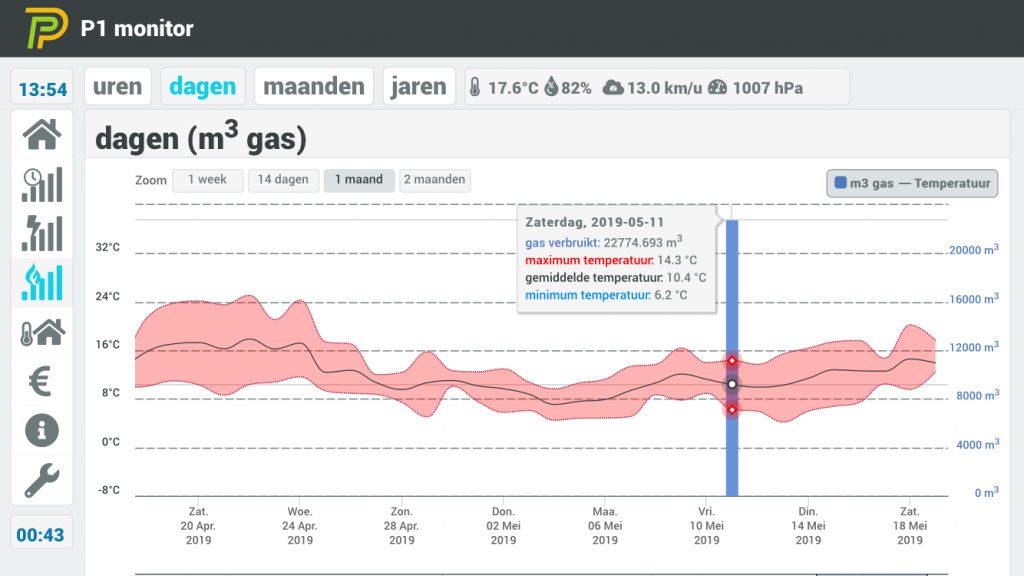
I’m not checking every day my measurements. It’s pure for logging and sending data to my Home Assistant. Yet a few days ago I saw only one bar in the graph: an usage of 22774.693m3 (?!?!) That’s a reading for one day…
So I decided to investigate what was the reason for this huge peak. 22774m3 costs about € 16.000,- This obviously is a misreading, as I use less then 1000m3 a year.
Exploring the database
The application p1mon (short for P1 monitor) is running on a dedicated Raspberry Pi 3b+ and is using sqlite as database. It’s located in a root folder “p1mon”. It’s designed to run the databases in the memory to safe the SD-card from multiple writes. So let’s find the databases.
p1mon@p1mon:/ $ cat /etc/fstab
 proc            /proc           proc    defaults          0       0
 PARTUUID=e08a2680-01  /boot           vfat    defaults          0       2
 PARTUUID=e08a2680-02  /               ext4    defaults,noatime  0       1
 tmpfs /p1mon/mnt/ramdisk tmpfs defaults,noatime,nosuid,mode=0777,size=85m 0 0
 tmpfs /var/log/nginx tmpfs defaults,noatime,nosuid,mode=0775,size=20m 0 0
 tmpfs /var/log/samba tmpfs defaults,noatime,nosuid,mode=0775,size=2m 0
 a swapfile is not a swap partition, no line here
 use  dphys-swapfile swap[on|off]  for that
 p1mon@p1mon:/ $ ls /p1mon/mnt/ramdisk/
 01_weer_historie.db
 02_temperatuur.db
 P1Api.pid
 P1Db.py.pid
 P1DropBoxDeamon.py.pid
 P1SerReader.py.pid
 P1UdpBroadcaster.py.pid
 P1UdpDaemon.py.pid
 P1Watchdog.py.pid
 basic.9988-114B-5AB8-C84C-A58C.json
 config.db
 dbx
 e_historie.db
 e_serial.db
 financieel.db
 p1mon-sql-export1558868567381.517.status
 p1msg.txt
 session.txt
 status.db
 upgrade-assist.status
 weer.db
 wifi_essid.txt
 p1mon@p1mon:/ $
Databases found
So the databases are in the memory/ramdisk of the Raspberry Pi. For now there is only 3 databases needed: e_historie.db, e_serial.db & financieel.db
e_historie.db: this database holds all the usage historie
e_serial.db: this database holds the reading for the last period
financial.db: this database has all the financial records
First database: e_serial.db
When looking into the e_serial.db database, I saw records from the last ~48 hours. So for me there was no need to modify this database (as for me the date was 11th May):
$ sqlite3 /p1mon/mnt/ramdisk/e_serial.db
 SQLite version 3.16.2 2017-01-06 16:32:41
 Enter ".help" for usage hints.
 sqlite> .tables
 e_serial
 sqlite> select * from e_serial limit 10;
 2019-05-24 07:34:05|1|2445.722|2098.403|1.545|0.0|D|0.289|0.0|816.294
 2019-05-24 07:34:14|1|2445.722|2098.403|1.545|0.0|D|0.294|0.0|816.294
 2019-05-24 07:34:23|1|2445.723|2098.403|1.545|0.0|D|0.289|0.0|816.294
 2019-05-24 07:34:32|1|2445.724|2098.403|1.545|0.0|D|0.3|0.0|816.294
 2019-05-24 07:34:42|1|2445.725|2098.403|1.545|0.0|D|0.288|0.0|816.294
 2019-05-24 07:34:52|1|2445.725|2098.403|1.545|0.0|D|0.293|0.0|816.294
 2019-05-24 07:35:01|1|2445.726|2098.403|1.545|0.0|D|0.299|0.0|816.294
 2019-05-24 07:35:10|1|2445.727|2098.403|1.545|0.0|D|0.293|0.0|816.294
 2019-05-24 07:35:19|1|2445.728|2098.403|1.545|0.0|D|0.294|0.0|816.294
 2019-05-24 07:35:28|1|2445.728|2098.403|1.545|0.0|D|0.293|0.0|816.294
 sqlite>
Second database: e_historie.db
When exploring the second database, I saw this was more ‘complex’. There where several tables within the database:
$ sqlite3 /p1mon/mnt/ramdisk/e_historie.db
 SQLite version 3.16.2 2017-01-06 16:32:41
 Enter ".help" for usage hints.
 sqlite> .tables
 e_history_dag    e_history_maand  e_history_uur
 e_history_jaar   e_history_min
 sqlite>
I knew I had to find the false readings and change them. There’s a table for minute, hour, day, month and year. First start with the _min database finding the wrong readings:
sqlite> .headers on
 sqlite> select * from e_history_min where timestamp like '2019-05-11%' or timestamp like '2019-05-12%';
 TIMESTAMP|VERBR_KWH_181|VERBR_KWH_182|GELVR_KWH_281|GELVR_KWH_282|VERBR_KWH_X|GELVR_KWH_X|TARIEFCODE|ACT_VERBR_KW_170|ACT_GELVR_KW_270|VERBR_GAS_2421
 …
 2019-05-11 23:51:00|2382.726|2036.366|1.545|0.0|0.00700000000051659|0.0|D|0.415|0.0|804.49
 2019-05-11 23:52:00|2382.732|2036.366|1.545|0.0|0.00599999999940337|0.0|D|0.4145|0.0|804.49
 2019-05-11 23:53:00|2382.74|2036.366|1.545|0.0|0.00799999999981083|0.0|D|0.414714285714286|0.0|804.49
 2019-05-11 23:54:00|2382.746|2036.366|1.545|0.0|0.00600000000031287|0.0|D|0.326|0.0|804.49
 2019-05-11 23:55:00|2382.75|2036.366|1.545|0.0|0.00399999999990541|0.0|D|0.285333333333333|0.0|23578.59
 2019-05-11 23:56:00|2382.755|2036.366|1.545|0.0|0.00500000000010914|0.0|D|0.291|0.0|23578.59
 2019-05-11 23:57:00|2382.76|2036.366|1.545|0.0|0.00500000000010914|0.0|D|0.289833333333333|0.0|23578.59
 2019-05-11 23:58:00|2382.764|2036.366|1.545|0.0|0.00399999999990541|0.0|D|0.2855|0.0|23578.59
 2019-05-11 23:59:00|2382.77|2036.366|1.545|0.0|0.00600000000031287|0.0|D|0.288714285714286|0.0|23578.59
 2019-05-12 00:00:00|2382.774|2036.366|1.545|0.0|0.00399999999899592|0.0|D|0.291166666666667|0.0|23578.59
 2019-05-12 00:00:00|2382.774|2036.366|1.545|0.0|0.00399999999899592|0.0|D|0.291166666666667|0.0|804.49
 2019-05-12 00:01:00|2382.779|2036.366|1.545|0.0|0.00500000000101863|0.0|D|0.290571428571429|0.0|804.49
 2019-05-12 00:02:00|2382.784|2036.366|1.545|0.0|0.00499999999919964|0.0|D|0.288833333333333|0.0|804.49
 2019-05-12 00:03:00|2382.788|2036.366|1.545|0.0|0.00400000000081491|0.0|D|0.290833333333333|0.0|804.49
 2019-05-12 00:04:00|2382.794|2036.366|1.545|0.0|0.00599999999940337|0.0|D|0.342857142857143|0.0|804.49
 …
 sqlite>
Bingo! 6 wrong readings (last field, VERBR_GAS_2421) found at 2019-05-11 23:55 ~ 2019-05-12 00:00. It shows that the reading was 23578.59 instead of 804.49. This should be 804.49 as it is incremental (see readings after 2019-05-12 00:00:00). So let’s change that:
sqlite> update e_history_min set VERBR_GAS_2421 = 804.49 where VERBR_GAS_2421 = 23578.59;
Next table is the _uur (hour). Let’s see the readings:
sqlite> select * from e_history_uur where timestamp like '2019-05-11%' or timestamp like '2019-05-12%';
 TIMESTAMP|VERBR_KWH_181|VERBR_KWH_182|GELVR_KWH_281|GELVR_KWH_282|VERBR_KWH_X|GELVR_KWH_X|TARIEFCODE|VERBR_GAS_2421|VERBR_GAS_X
 …
 2019-05-11 17:00:00|2380.16|2036.366|1.545|0.0|0.158999999999651|0.0|D|804.33|0.0
 2019-05-11 18:00:00|2380.418|2036.366|1.545|0.0|0.257999999999811|0.0|D|804.33|0.0
 2019-05-11 19:00:00|2380.595|2036.366|1.545|0.0|0.17699999999968|0.0|D|804.44|0.11
 2019-05-11 20:00:00|2381.434|2036.366|1.545|0.0|0.839000000000851|0.0|D|804.49|0.05
 2019-05-11 21:00:00|2381.848|2036.366|1.545|0.0|0.41399999999976|0.0|D|804.49|0.0
 2019-05-11 22:00:00|2382.357|2036.366|1.545|0.0|0.509000000000015|0.0|D|804.49|0.0
 2019-05-11 23:00:00|2382.77|2036.366|1.545|0.0|0.413000000000466|0.0|D|23578.59|22774.1 (0.0)
 2019-05-12 00:00:00|2383.26|2036.366|1.545|0.0|0.489999999999782|0.0|D|804.49|22774.1 (0.0)
 2019-05-12 01:00:00|2383.991|2036.366|1.545|0.0|0.730999999999767|0.0|D|804.49|0.0
 2019-05-12 02:00:00|2384.188|2036.366|1.545|0.0|0.197000000000116|0.0|D|804.49|0.0
 2019-05-12 03:00:00|2384.349|2036.366|1.545|0.0|0.161000000000058|0.0|D|804.49|0.0
 2019-05-12 04:00:00|2384.606|2036.366|1.545|0.0|0.256999999999607|0.0|D|804.49|0.0
 …
 sqlite>
Here there are two wrong readings at 2019-05-11 23:00:00 and 2019-05-12 00:00:00 at the last two fields (VERBR_GAS_2421 and VERBR_GAS_X). The last field is the usage of that hour and the other field is the meter reading of that hour. As the reading after is the same as before (804.49) there is no gas used. Updating these records is simple:
sqlite> update e_history_uur set VERBR_GAS_2421 = 804.49 where TIMESTAMP = '2019-05-11 23:00:00';
sqlite> update e_history_uur set VERBR_GAS_X = 0.0 where TIMESTAMP = '2019-05-11 23:00:00';
sqlite> update e_history_uur set VERBR_GAS_X = 0.0 where TIMESTAMP = '2019-05-12 00:00:00';
The _dag (day) table; Let’s read it out:
sqlite> select * from e_history_dag where TIMESTAMP like '2019-05-1%';
 2019-05-10 00:00:00|2376.275|2036.366|1.545|0.0|10.6689999999999|0.0|803.897|1.17600000000004
 2019-05-11 00:00:00|2382.77|2036.366|1.545|0.0|6.49500000000081|0.0|23578.59|22774.693
 2019-05-12 00:00:00|2389.324|2036.366|1.545|0.0|6.55400000000009|0.0|805.069|0.0
 2019-05-13 00:00:00|2391.049|2046.827|1.545|0.0|12.1859999999997|0.0|806.189|1.12
 2019-05-14 00:00:00|2392.692|2052.946|1.545|0.0|7.76199999999972|0.0|807.037|0.84800000000007
 2019-05-15 00:00:00|2394.358|2063.535|1.545|0.0|12.2550000000001|0.0|807.482|0.444999999999936
 2019-05-16 00:00:00|2396.001|2068.52|1.545|0.0|6.62800000000061|0.0|808.147|0.665000000000077
 2019-05-17 00:00:00|2398.266|2074.308|1.545|0.0|8.05299999999988|0.0|809.081|0.933999999999969
 2019-05-18 00:00:00|2405.046|2074.308|1.545|0.0|6.77999999999884|0.0|809.952|0.870999999999981
 2019-05-19 00:00:00|2420.953|2074.308|1.545|0.0|15.9070000000011|0.0|810.887|0.934999999999945
Shown is that the reading for the 11th is way too high and for the 12th too low (0.0). Those two days can easily be fixed with a summary of all readings of that day:
sqlite> select sum(VERBR_GAS_X) from e_history_uur where TIMESTAMP like '2019-05-11%';
 0.593
 sqlite> select sum(VERBR_GAS_X) from e_history_uur where TIMESTAMP like '2019-05-12%';
 0.579
 sqlite> update e_history_dag set VERBR_GAS_2421 = 804.49 where TIMESTAMP = '2019-05-11 00:00:00';
 sqlite> update e_history_dag set VERBR_GAS_X = 0.593 where TIMESTAMP = '2019-05-11 00:00:00';
 sqlite> update e_history_dag set VERBR_GAS_X = 0.579 where TIMESTAMP = '2019-05-12 00:00:00';
The last two tables, _maand (month) and _jaar (year), are still being updated as the month is still May and more readings are to come. These two tables are updated the same way as the _dag table: summary:
sqlite> select sum(VERBR_GAS_X) from e_history_dag where TIMESTAMP like '2019-05%';
 26.7750000000002
 sqlite> update e_history_maand set VERBR_GAS_X = 26.775 where TIMESTAMP = '2019-05-01 00:00:00';
 sqlite> select sum(VERBR_GAS_X) from e_history_maand where TIMESTAMP like '2019%';
 417.627
 sqlite> update e_history_jaar set VERBR_GAS_X = 417.627 where TIMESTAMP = '2019-01-01 00:00:00';
Third database: financial.db
The 3rd and last database is way easier then the previous one, as all readings are now known. The database contains 3 tables:
e_financieel_dag: all financial data per day
e_financieel_maand: all financial data per month
e_financieel_jaar: all financial data per year
This is what’s in the database now, and should be changed:
sqlite3 financieel.db
 SQLite version 3.27.2 2019-02-25 16:06:06
 Enter ".help" for usage hints.
 sqlite> .headers on
 sqlite> .tables
 e_financieel_dag    e_financieel_jaar   e_financieel_maand
 sqlite> select * from e_financieel_dag where timestamp like '2019-05-11 00:00:00' or timestamp like '2019-05-12 00:00:00';
 TIMESTAMP|VERBR_P|VERBR_D|GELVR_P|GELVR_D|GELVR_GAS
 2019-05-11 00:00:00|0.0|1.38103185000017|0.0|0.0|16196.3675943803
 2019-05-12 00:00:00|0.0|1.39357702000002|0.0|0.0|0.600161290322581
 sqlite> select * from e_financieel_maand where timestamp like '2019-05-01 00:00:00';
 TIMESTAMP|VERBR_P|VERBR_D|GELVR_P|GELVR_D|GELVR_GAS
 2019-05-01 00:00:00|27.4448767000007|23.7816023499989|0.0|0.0|16228.9785267381
 sqlite> select * from e_financieel_jaar where timestamp like '2019-01-01 00:00:00';
 TIMESTAMP|VERBR_P|VERBR_D|GELVR_P|GELVR_D|GELVR_GAS
 2019-01-01 00:00:00|155.341987940001|172.037019329998|0.0|0.0|16579.8112669474
 sqlite>
Updating the daily table is quit tricky, as I have to recalculate how much it has cost me. One m3 gas costs about € 0,71113. Besides that, there is also a monthly charge which is € 18,605. Calculating the daily cost is the daily consumption * 0.71113 + 18.605/31.
For May 11th that is: 0.593 * 0.71113 + 18.605 / 31 is € 1.02170009
For May 12th that is: 0.579 * 0.71113 + 18.605 / 31 – € 1.01174427
(Of course there are some rounding errors, I’ll take that for granted and have a readable graph).
sqlite> select VERBR_GAS_X from e_history_dag where TIMESTAMP is '2019-05-11 00:00:00';
 0.593 (0.593 * 0.71113 + 0.6 = 1.02170009)
sqlite> select VERBR_GAS_X from e_history_dag where TIMESTAMP is '2019-05-12 00:00:00';
 0.579 (0.579 * 0.71113 + 0.6 = 1.01174427)
sqlite> update e_financieel_dag set GELVR_GAS = 1.02170009 where TIMESTAMP = '2019-05-11 00:00:00';
sqlite> update e_financieel_dag set GELVR_GAS = 1.01174427 where TIMESTAMP = '2019-05-12 00:00:00';
The last two tables (_maand and _jaar) are easily updated by using the summary function again:
Monthly table:
sqlite> select sum(GELVR_GAS) from e_financieel_dag where timestamp like '2019-05%';
 34.977896687742
sqlite> update e_financieel_maand set GELVR_GAS = 34.977896687742 where timestamp = '2019-05-01 00:00:00';

Yearly table:
sqlite> select sum(GELVR_GAS) from e_financieel_dag where timestamp like '2019%';
 385.810636897097
sqlite> update e_financieel_jaar set GELVR_GAS = 385.810636897097 where timestamp = '2019-01-01 00:00:00';
Well, that was a lot of database hacking… did it worked?
After changing the readings and recalculating all the minutely, hourly, daily, monthly and yearly values, the graph is readable again. Instead of this:
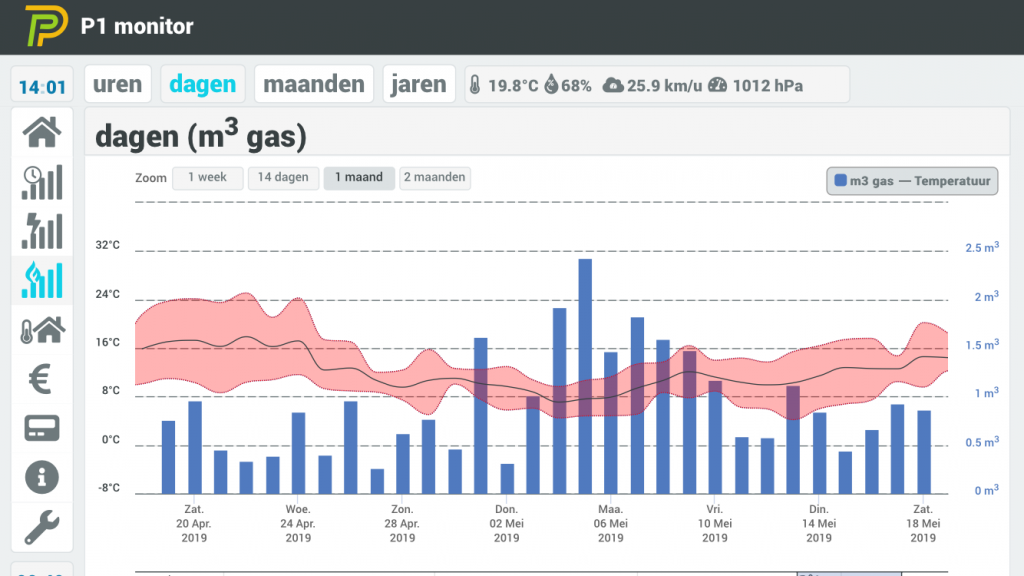
Now it’s more readable like this:
Credits
P1 monitor is free to use and can be downloaded at https://ztatz.nl/. Monthly there will be a new release with either new features or bug fixes. Their support is great. They help you where they can. Of course I had to figure out how to fix this reading. Yet that was due to some wrong reading given by the meter and not due to the software. On their forum they helped me by pointing out by pointing out how the application works, and how to edit the database. My knowledge of SQL is more than average and that came quit handy now.
If you consider to use this application and like it like I do, than please consider for a small donation via PayPal for all their hard work:

Peter
Bedankt, ik had eenzelfde soort fout in de ‘uur’ db, heb ik nu kunnen verhelpen met behulp van deze goede uitleg.
Marcel
Graag gedaan! Kennelijk zijn die P1 berichtjes toch niet helemaal “bullet-proof” 😉
Peter
Het is wel gebeurd tijdens wat her-configuratie, dus human error kan ik niet helemaal uitsluiten.. 🙂
Marcel
Maar p1mon leest je P1 meter uit, daar heb je geen invloed op, behalve wat je daadwerkelijk verbruikt 😉 Bij mij stonden er 6 extreem hoge waardes tussen, en daarna weer de normale 😉
Peter
Ik heb sinds vanmorgen om 06:00u weer zo’n stomme piek erin, zodra ik hem update is het 10 seconden goed en daarna staan de waardes weer verkeerd.. hoe kan dit nu weer.
De afwijking is alleen te zien in de tabel ‘uur’, en dan kolom VERBR_GAS_X (deze laat zich veranderen en ‘reset’ hij weer naar de hoge waarde..
***
2019-05-30 06:00:00|3126.15|2516.895|0.729|0.0|0.173000000000684|0.0|D|2078.791|2078.791
***
Enig idee?
Marcel
Heb je de _min ook bekeken? Als daar ook verkeerde waardes in staan, heb je kans dat de _uur automatisch wordt geüpdate.
Ik heb echt bottom-up gewerkt. Eerst de min rechtzetten, daarna uur, dag, maand, jaar.
Ik heb eerst alle queries in een kladblok gezet en daarna stuk voor stuk uitgevoerd.
Ook lees ik dat jij de huidige dag wil aanpassen. De huidige dag word continu ge-update. Wacht even totdat het juni is. Dan kan je daarna op je gemak de maand mei updaten. Wel kan je de _min updaten, daar komen alleen records bij.
Peter
Hoi, inderdaad zit de fout ook in _min, ik had die niet gezien, gezien de hoeveelheid data.
Ik heb de file even in een SQLite DB browser gezet, zoekt wat makkelijker en daar staan inderdaad 4 records met 4x 0.0, helemaal aan het eind van het 06u (6:56-6:59) , was teveel gefocust op 06:00, maar dat kan natuurlijk elke minuut binnen dat uur zijn.
Anyway, alles gelukt nu, thanx!
Marcel
Top!!!
SecBro
Mooi werk, leuk om te zien dat iemand de moeite neemt om te helpen. Wat betreft de foute meldingen we doen er alles aan om alleen de juiste waarden te verwerken maar als een telegram corrupt raakt maar het lijkt op een goede waarde dan wordt deze helaas toch verwerkt.
Marcel
Bedankt voor je reactie! Maar dat is precies waar het om gaat. Als een ieder dit soort probleempjes kan beschrijven hoe je het oplost, help je elkaar, en zelf zal ik ook wel eens hulp nodig hebben 😉
Andy
Hoi Marcel,
Ik lees dat jij naast de P1 Monitor gegeven inleest in je Home Assistant omgeving.
Nu wil ik dat ook maar heb dus de raspberry in meterkast hangen met P1 Monitor en het systeem
wat HA draait staat op zolder.
Op welke manier kan ik de gegevens in HA inlezen van P1 Monitor ? Doe je dit met de DSMR component ?
Alvast bedankt.
Marcel
Hey Andy, ik heb in home assistant daar gewoon sensoren voor aangemaakt:
platform: restresource: http://mijn.ip.adres/api/v1/smartmeter?limit=1&json=object&round=off
name: Gas verbruik
value_template: '{{ value_json.0.CONSUMPTION_GAS_M3 }}'
unit_of_measurement: "m³"
platform: rest
resource: http://mijn.ip.adres/api/v1/smartmeter?limit=1&json=object&round=on
name: Huidig verbruik
value_template: '{{ value_json.0.CONSUMPTION_W }}'
unit_of_measurement: "W"
platform: rest
resource: http://mijn.ip.adres/api/v1/smartmeter?limit=1&json=object&round=off
name: Meterstand hoog
value_template: '{{ value_json.0.CONSUMPTION_KWH_HIGH | round(2) }}'
unit_of_measurement: "kWh"
platform: rest
resource: http://mijn.ip.adres/api/v1/smartmeter?limit=1&json=object&round=off
name: Meterstand laag
value_template: '{{ value_json.0.CONSUMPTION_KWH_LOW | round(2) }}'
unit_of_measurement: "kWh"
Andy
Bedankt !!! Ik ga hier meteen mee aan de slag vanavond 🙂
vjmaz
Hi my name is Maz from Australia can you please email me I can not find any contact details at all
I want to purchase many of your products that work with Home Assistant Please ..
I was trying to get a hold of Marcel Z but no luck
I’m interested in the following
Energy Meter ( DSMR component for ESPHome ) Connect using a P1 port ( SlimmeLezer )
DoorBell
GAS Meter i think uses Connect using a P1 port also ( SlimmeLezer )
Thank you regards Maz
vjmaz@hotmail.com
Marcel
I’ve sent you an email 🙂